- Popular tools for analyzing executables/ binaries
- Jargon
- Pre-requisite installations
- File required for exercise
- Exercises
- Quiz
Popular tools for analyzing executables/ binaries
In this tutorial we will look at some of the popular tools for analyzing executables/ binaries. We divide the tools into two categories i.e Static analysis tools and Dynamic analysis tools.
- Static analysis tools
objdump: ELF Object file extractorreadelf: ELF readerstrings: Extract strings from binaries
- Dynamic analysis tools
strace: System call tracerltrace: Library call tracer
Jargon
- Static analysis tools: Tools that help to analyse binaries without executing it
- Dynamic analysis tools: Tools that execute binaries the binary and capture details that will to analyse the binary
- Sandbox: Its a isolated environment for executing binaries
If you are analysing malware care should be taken while using dynamic analysis tools. They can harm your system. Hence malware analysis is carried out in a sandbox environmemt.
Pre-requisite installations
1
2
3
sudo apt-get install binutils
sudo apt-get install strace
sudo apt-get install ltrace
File required for exercise
bindemo.c
1
2
3
4
5
6
7
8
9
10
11
12
#include <stdio.h>

int main(int argc, char const *argv[])
{
  FILE *fp;

  fp = fopen("out.txt", "w");
  fprintf(fp, "%s\n", "binarydemo");
  fclose(fp);

  return 0;
}
Compile the program using gcc as shown below:
1
gcc -o bindemo bindemo.c
Exercises
Exercise #1: How to dissassemble the binary using objdump?
To see the dissassembly of the code section of the binary use the following command:
1
objdump -S ./bindemo
The snapshot below shows a part of the dissassembly for the binary specifically for the main function:
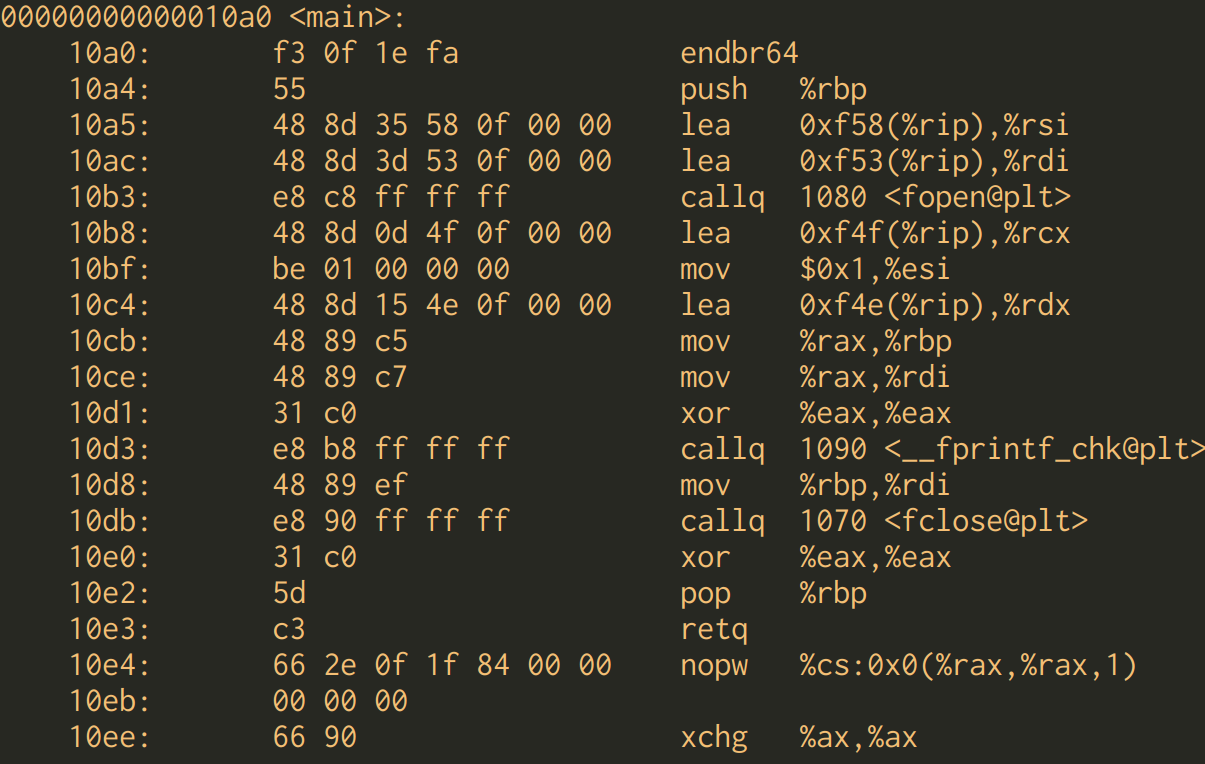
Following are the main observations on the output as shown in the snapshot below.
Exercise #2: Yet another way to analyse the binary using readelf?
To see the header information in the binary use the following command:
1
readelf -h ./bindemo
The snapshot below shows header for the binary:

Following are the main observations on the output as shown in the snapshot below.
- Its a
64 bit ELFfile - The binary can execute on
UNIXbased OS and isSystem Vcompliant (ABI => Application Binary Interface) - The hardware architecture the binary would execute is
x86-64 - The entry point of the program is at an offset of
0x10f0
Exercise #3: How to dump all the strings inside a binary using strings?
To see the strings inside the binary use the following command:
1
strings bindemo
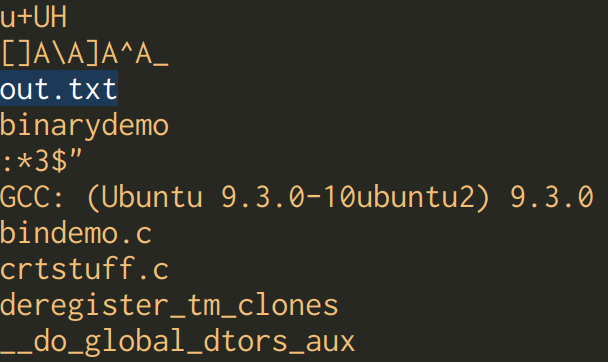
You can observe the string out.txt which was the name of the file that was opened.
Exercise #4: How to trace system calls using strace?
strace is an utility that intercepts and records system calls. This is useful while debugging and while performing security analysis on binaries.
Use the strace utility as below:
1
strace ./bindemo
Output of strace is shown in the snapshot below.
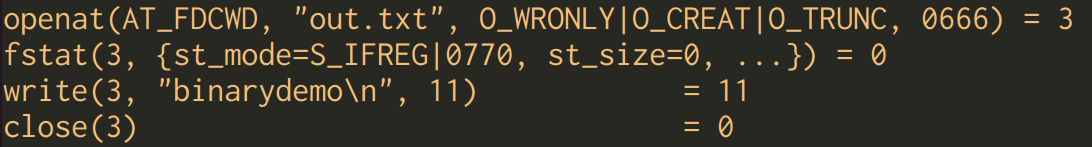
Following are the main observations on the output as shown in the snapshot below.
- Use of
openatsystem call to open a file - Flag
AF_FDCWDis depicting that the file is in Current Working Directory (CWD) - File will be created if it does not exists (
O_CREATflag) - File is opened for writing (
O_WRONLYflag) - If the file exists it will be truncated to length 0 (
O_TRUNCflag) - The process get information about the status of the file using
fstatsystem call - It then writes the string
binarydemointo the file which is string of length11 - The process finally closes the opened file using the system call
close